
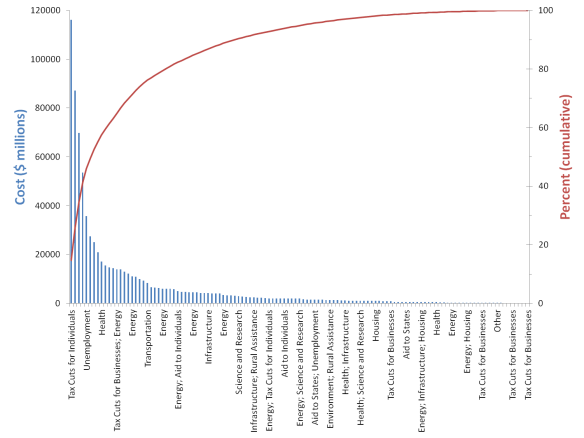
Figure 1. Pareto plot shows Obama’s 2009 stimulus spending was wasteful.
Much of the wasteful spending by Barack Obama – such as his failed stimulus of 2009 – could be prevented through the use of a simple statistical tool
The Economy’s Performance Gap
Barack Obama’s handling of the economy — America’s most important problem — has been disappointing.
The disappointment began in January 2009, when he revealed his original plan to stimulate the economy in exchange for more than $787 billion in taxpayer spending.
“We seem to be facing two major economic gaps,” said Nobel winning economist Paul Krugman that January, warning how the Obama plan was likely to fail, “the gap between the economy’s potential and its likely performance, and the gap between Mr. Obama’s stern economic rhetoric and his somewhat disappointing economic plan.”
A simple statistical tool shows how the potential for such massive spending could have met performance expectations through executive leadership for high-quality results in the economy.
Wasteful Spending Exposed
Commonly known as the “80-20 rule,” Pareto’s law not only states that for many events, 80 percent of the effects are due to 20 percent of the causes. It’s also used as a statistical tool in quality control to observe and measure maldistribution.
To see if the failure of Obama’s stimulus could be partly explained by such inefficient distribution of funds, a Pareto plot was created for the programs in his spending plan. Results showed that Obama’s spending was indeed maldistributed in a wasteful manner, with 80 percent of the funds distributed to only 20 percent of the programs (Figure 1).
Furthermore, it was observed that despite environment, infrastructure, rural assistance, and other assigned as low-priority categories, distributed only in the bottom 80 percent of spending programs, Obama still spent a whopping $56 billion on those same, four categories the distribution would have shown him beforehand as low priority.
Obama Defined by Maldistribution Curve
To determine the degree to which the maldistribution of Obama’s stimulus spending is associated with the Pareto distribution with probability density function (PDF)


normalized values for the Pareto PDF were plotted as a function of normalized values for spending. Linear regression by method of least squares fitting revealed a near-perfect correlation between the values, with the fitted line’s slope (R) equal to 0.9962 (Figure 2).

The 80-20 rule shows how a president with a real understanding of the economy could have achieved better results with $787 billion in stimulus spending. The same amount could have been 80 percent more effective by using the simple statistical tool.
Restoring American Supremacy
“It’s clear that the job could have been done better,” said the chairman of the non-partisan Recovery Accountability and Transparency Board, describing Obama’s maldistribution of taxpayer funds in an interview with The Wall Street Journal.
And what’s most clear of all — with a year left in Obama’s term and unemployment higher than the eight-percent maximum he guaranteed with his stimulus spending — is that it’s time for a president with a real understanding of the economy to restore America’s global supremacy, beginning at its weakest link among the bottom 80 percent of incomes.
References
Farhana Hossain, Amanda Cox, John McGrath, and Stephan Weitberg, “The Stimulus Plan: How to Spend $787 Billion,” The New York Times, accessed December 9, 2011, http://projects.nytimes.com/44th_president/stimulus.
